Titrations I
Learning Objectives
By the end of this section, you will be able to:
- Describe the fundamental aspects of titrations.
- Perform stoichiometric calculations using typical titration data.
In the 18th century, the strength (actually the concentration) of vinegar samples was determined by noting the amount of potassium carbonate, K2CO3, which had to be added, a little at a time, before bubbling ceased. The greater the weight of potassium carbonate added to reach the point where the bubbling ended, the more concentrated the vinegar.
We now know that the effervescence that occurred during this process was due to reaction with acetic acid, CH3CO2H, the compound primarily responsible for the odor and taste of vinegar. Acetic acid reacts with potassium carbonate according to the following equation:
The bubbling was due to the production of CO2.
The test of vinegar with potassium carbonate is one type of quantitative analysis—the determination of the amount or concentration of a substance in a sample. In the analysis of vinegar, the concentration of the solute (acetic acid) was determined from the amount of reactant that combined with the solute present in a known volume of the solution. In other types of chemical analyses, the amount of a substance present in a sample is determined by measuring the amount of product that results.
28.1 Titration
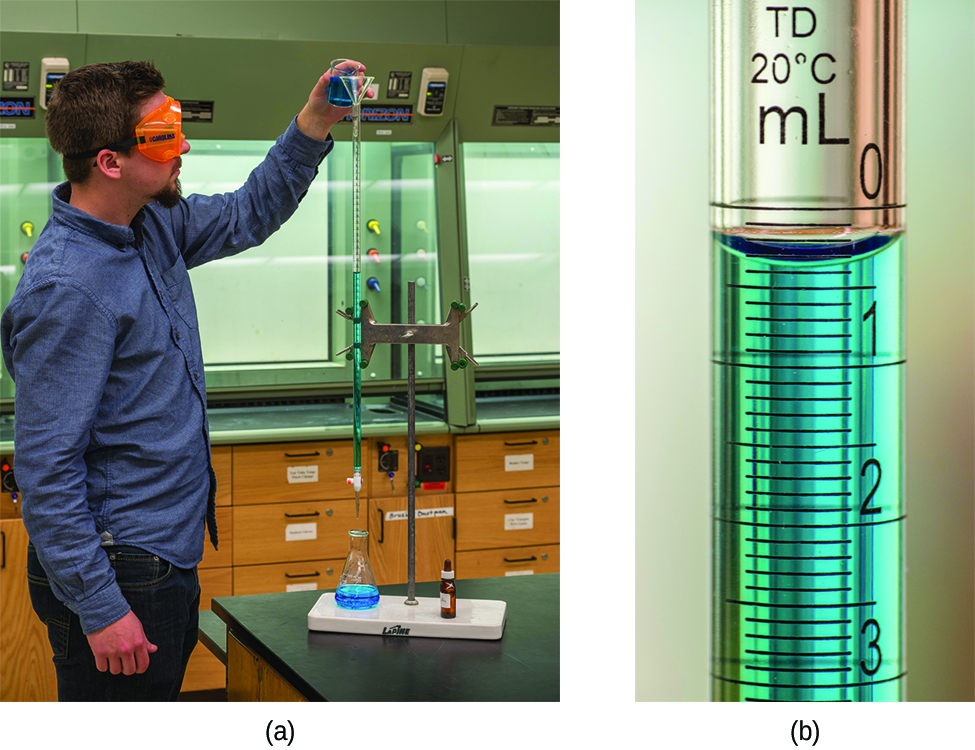
The described approach to measuring vinegar strength was an early version of the analytical technique known as titration analysis. A typical titration analysis involves the use of a buret (Figure 7.16) to make incremental additions of a solution containing a known concentration of some substance (the titrant) to a sample solution containing the substance whose concentration is to be measured (the analyte). The titrant and analyte undergo a chemical reaction of known stoichiometry, and so measuring the volume of titrant solution required for complete reaction with the analyte (the equivalence point of the titration) allows calculation of the analyte concentration. The equivalence point of a titration may be detected visually if a distinct change in the appearance of the sample solution accompanies the completion of the reaction. The halt of bubble formation in the classic vinegar analysis is one such example, though, more commonly, special dyes called indicators are added to the sample solutions to impart a change in color at or very near the equivalence point of the titration. Equivalence points may also be detected by measuring some solution property that changes in a predictable way during the course of the titration. Regardless of the approach taken to detect a titration’s equivalence point, the volume of titrant actually measured is called the end point. Properly designed titration methods typically ensure that the difference between the equivalence and end points is negligible. Though any type of chemical reaction may serve as the basis for a titration analysis, the three described in this chapter (precipitation, acid-base, and redox) are most common. Additional details regarding titration analysis are provided in the chapter on acid-base equilibria.
Figure 28.1
(a) A student fills a buret in preparation for a titration analysis. (b) A typical buret permits volume measurements to the nearest 0.01 mL. (credit a: modification of work by Mark Blaser and Matt Evans; credit b: modification of work by Mark Blaser and Matt Evans)
EXAMPLE 28.1.1
Titration Analysis
The end point in a titration of a 50.00-mL sample of aqueous HCl was reached by addition of 35.23 mL of 0.250 M NaOH titrant. The titration reaction is:What is the molarity of the HCl?
Solution
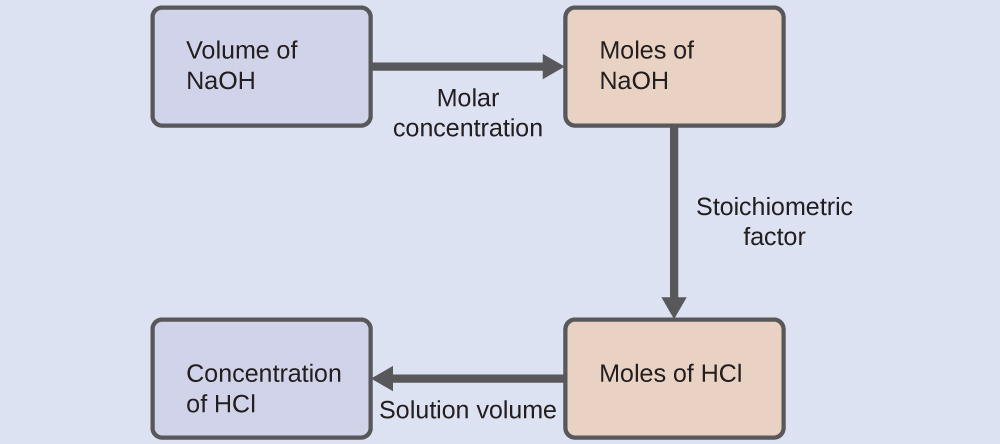
As for all reaction stoichiometry calculations, the key issue is the relation between the molar amounts of the chemical species of interest as depicted in the balanced chemical equation. The approach outlined in previous modules of this chapter is followed, with additional considerations required, since the amounts of reactants provided and requested are expressed as solution concentrations.For this exercise, the calculation will follow the following outlined steps:
The molar amount of HCl is calculated to be:
Using the provided volume of HCl solution and the definition of molarity, the HCl concentration is:
Note: For these types of titration calculations, it is convenient to recognize that solution molarity is also equal to the number of millimoles of solute per milliliter of solution:
Using this version of the molarity unit will shorten the calculation by eliminating two conversion factors:
Check Your Learning
A 20.00-mL sample of aqueous oxalic acid, H2C2O4, was titrated with a 0.09113-M solution of potassium permanganate, KMnO4 (see net ionic equation below).A volume of 23.24 mL was required to reach the end point. What is the oxalic acid molarity?
Answer
0.2648 M
Learning Objectives
By the end of this section, you will be able to:
- Interpret titration curves for strong acid-base systems
- Compute sample pH at important stages of a titration
- Explain the function of acid-base indicators
As seen in the chapter on the stoichiometry of chemical reactions, titrations can be used to quantitatively analyze solutions for their acid or base concentrations. In this section, we will explore the underlying chemical equilibria that make acid-base titrimetry a useful analytical technique.
28.2 Titration Curves
A titration curve is a plot of some solution property versus the amount of added titrant. For acid-base titrations, solution pH is a useful property to monitor because it varies predictably with the solution composition and, therefore, may be used to monitor the titration’s progress and detect its end point. The following example exercise demonstrates the computation of pH for a titration solution after additions of several specified titrant volumes. The following example involves a strong acid titration that requires only stoichiometric calculations to derive the solution pH.
EXAMPLE 28.2.1
Calculating pH for Titration Solutions: Strong Acid/Strong Base
A titration is carried out for 25.00 mL of 0.100 M HCl (strong acid) with 0.100 M of a strong base NaOH (the titration curve is shown in Figure 14.18). Calculate the pH at these volumes of added base solution:
(a) 0.00 mL
(b) 12.50 mL
(c) 25.00 mL
(d) 37.50 mL
Solution
(a) Titrant volume = 0 mL. The solution pH is due to the acid ionization of HCl. Because this is a strong acid, the ionization is complete and the hydronium ion molarity is 0.100 M. The pH of the solution is then
(b) Titrant volume = 12.50 mL. Since the acid sample and the base titrant are both monoprotic and equally concentrated, this titrant addition involves less than a stoichiometric amount of base, and so it is completely consumed by reaction with the excess acid in the sample. The concentration of acid remaining is computed by subtracting the consumed amount from the intial amount and then dividing by the solution volume:
(c) Titrant volume = 25.00 mL. This titrant addition involves a stoichiometric amount of base (the equivalence point), and so only products of the neutralization reaction are in solution (water and NaCl). Neither the cation nor the anion of this salt undergo acid-base ionization; the only process generating hydronium ions is the autoprotolysis of water. The solution is neutral, having a pH = 7.00.
(d) Titrant volume = 37.50 mL. This involves the addition of titrant in excess of the equivalence point. The solution pH is then calculated using the concentration of hydroxide ion:
pH = 14 − pOH = 14 + log([OH−]) = 14 + log(0.0200) = 12.30
Check Your Learning
Calculate the pH for the strong acid/strong base titration between 50.0 mL of 0.100 M HNO3(aq) and 0.200 M NaOH (titrant) at the listed volumes of added base: 0.00 mL, 15.0 mL, 25.0 mL, and 40.0 mL.
Answer
0.00: 1.000; 15.0: 1.5111; 25.0: 7; 40.0: 12.523
28.3 Acid-Base Indicators
Certain organic substances change color in dilute solution when the hydronium ion concentration reaches a particular value. For example, phenolphthalein is a colorless substance in any aqueous solution with a hydronium ion concentration greater than 5.0×10⁻⁹ M (pH < 8.3). In more basic solutions where the hydronium ion concentration is less than 5.0×10⁻⁹ M (pH > 8.3), it is red or pink. Substances such as phenolphthalein, which can be used to determine the pH of a solution, are called acid-base indicators. Acid-base indicators are either weak organic acids or weak organic bases.
The equilibrium in a solution of the acid-base indicator methyl orange, a weak acid, can be represented by an equation in which we use HIn as a simple representation for the complex methyl orange molecule:
The anion of methyl orange, In−, is yellow, and the nonionized form, HIn, is red. When we add acid to a solution of methyl orange, the increased hydronium ion concentration shifts the equilibrium toward the nonionized red form, in accordance with Le Châtelier’s principle. If we add base, we shift the equilibrium towards the yellow form. This behavior is completely analogous to the action of buffers.
The perceived color of an indicator solution is determined by the ratio of the concentrations of the two species In− and HIn. If most of the indicator (typically about 60−90% or more) is present as In−, the perceived color of the solution is yellow. If most is present as HIn, then the solution color appears red. The Henderson-Hasselbalch equation is useful for understanding the relationship between the pH of an indicator solution and its composition (thus, perceived color):
In solutions where pH > pKa, the logarithmic term must be positive, indicating an excess of the conjugate base form of the indicator (yellow solution). When pH < pKa, the log term must be negative, indicating an excess of the conjugate acid (red solution). When the solution pH is close to the indicator pKa, appreciable amounts of both conjugate partners are present, and the solution color is that of an additive combination of each (yellow and red, yielding orange). The color change interval (or pH interval) for an acid-base indicator is defined as the range of pH values over which a change in color is observed, and for most indicators this range is approximately pKa ± 1.
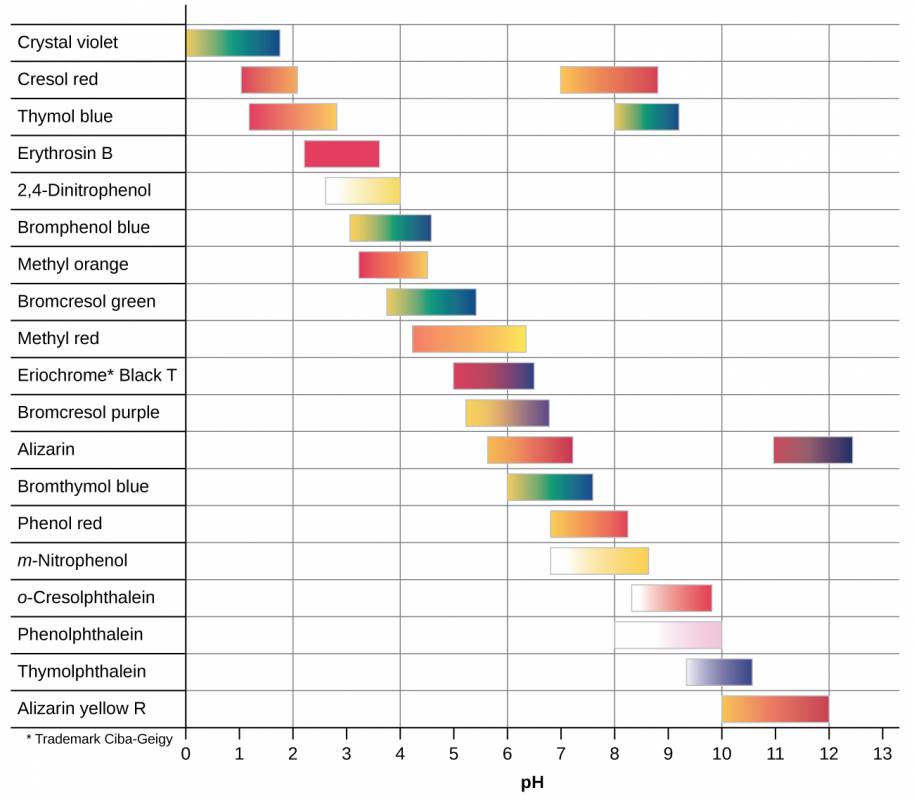
There are many different acid-base indicators that cover a wide range of pH values and can be used to determine the approximate pH of an unknown solution by a process of elimination. Universal indicators and pH paper contain a mixture of indicators and exhibit different colors at different pHs. Figure 29.2 presents several indicators, their colors, and their color-change intervals.
Figure 28.2
This chart illustrates the color change intervals for several acid-base indicators.
Titration curves for strong and weak acids illustrating the proper choice of acid-base indicator. Any of the three indicators will exhibit a reasonably sharp color change at the equivalence point of the strong acid titration, but only phenolphthalein is suitable for use in the weak acid titration.
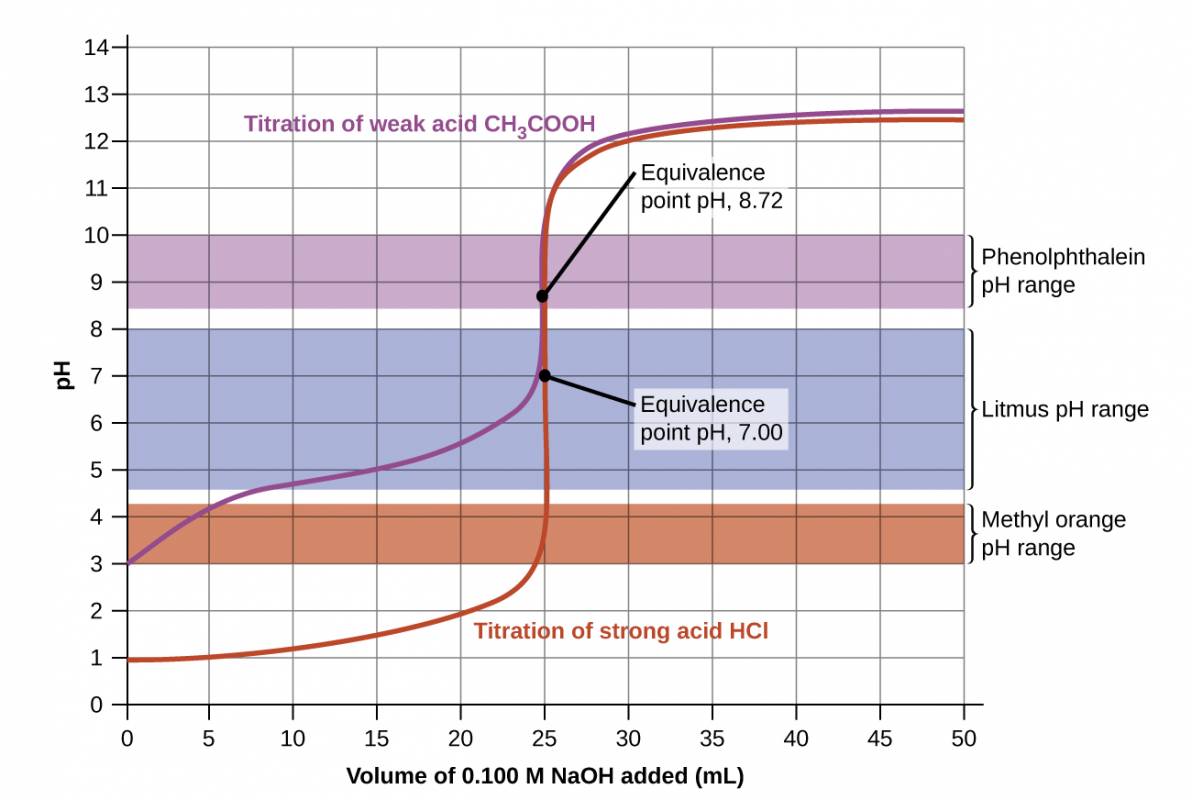
The titration curves shown in Figure 28.3 illustrate the choice of a suitable indicator for specific titrations. In the strong acid titration, use of any of the three indicators should yield reasonably sharp color changes and accurate end point determinations. For this titration, the solution pH reaches the lower limit of the methyl orange color change interval after addition of ~24 mL of titrant, at which point the initially red solution would begin to appear orange. When 25 mL of titrant has been added (the equivalence point), the pH is well above the upper limit and the solution will appear yellow. The titration's end point may then be estimated as the volume of titrant that yields a distinct orange-to-yellow color change. This color change would be challenging for most human eyes to precisely discern. More-accurate estimates of the titration end point are possible using either litmus or phenolphthalein, both of which exhibit color change intervals that are encompassed by the steep rise in pH that occurs around the 25.00 mL equivalence point.
The weak acid titration curve in Figure 28.3 shows that only one of the three indicators is suitable for end point detection. If methyl orange is used in this titration, the solution will undergo a gradual red-to-orange-to-yellow color change over a relatively large volume interval (0–6 mL), completing the color change well before the equivalence point (25 mL) has been reached. Use of litmus would show a color change that begins after adding 7–8 mL of titrant and ends just before the equivalence point. Phenolphthalein, on the other hand, exhibits a color change interval that nicely brackets the abrupt change in pH occurring at the titration's equivalence point. A sharp color change from colorless to pink will be observed within a very small volume interval around the equivalence point.